Most of the time when ever we have data, end users will expect some kind of reports/charts.
For example when we are using tasks, we may have to provide a pie chart indicating the different status in the pie chart. Or We may have to show a visual indicator for the percentage completion for each task item.
We can create the charts by using any of the tools on MOSS 2007:
1. Excel Services (Excel Web Access)
2. Reporting Services
3. Silver Light, etc
In order to use these features we should have MOSS 2007 License and also some environments there will be restrictions on custom coding. By keeping this points in mind I came up with this Post.
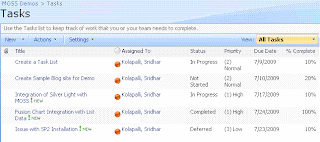
Here we will see how we can utilize the Fusion Charts for the SharePoint List (Task List). Following image shows the sample Task List:
Following are the steps to implement the fusion charts:
1. Download
Fusion Charts and upload to a document library. In this case I created a separate document library called FusionCharts where all the fusion charts are uploaded.
2. Come up with the
RPC Protocol URL for extracting the data from the task list.
In our case following is the URL:
http://localhost/sites/MOSSDemos/_vti_bin/owssvr.dll?Cmd=Display&Query=Status&List=%7B7C6C7072%2D12B5%2D4B05%2D90A4%2D052160CC8F74%7D&XMLDATA=TRUE
Note that we are extracting only the Status field from the Task List.
And the List id is the Task List Guiid within the SharePoint Site.
3. Copy the following javascript into the content editor web part:
<script language="javascript">
function fnXmlHttp(AspFileName,strXML)
{
var objXMLHttp= new ActiveXObject("Microsoft.XMLHTTP");
var sResponse;
try
{
objXMLHttp.open("POST",AspFileName,false) //POSTING THE DATA
objXMLHttp.setRequestHeader("Content-Type", "text/xml");
objXMLHttp.send(strXML)
}
catch(e)
{
}
if (parseInt(objXMLHttp.Status) != 200)
{
sResponse = "N,Cannot connect to the Server.";
}
else
{
sResponse=new String(objXMLHttp.responseText);
if (sResponse == "")
{
sResponse = "N,Error at server. Please contact administrator.";
}
}
return sResponse;
}
var sXML;
var bLoad;
var sSiteUrl = "http://localhost/sites/MOSSDemos/_vti_bin/owssvr.dll?";
// This Parameter Contains List Id too
var sCmdParameters = "Cmd=Display&Query=Status&List=%7B7C6C7072%2D12B5%2D4B05%2D90A4%2D052160CC8F74%7D&XMLDATA=TRUE"
// Request the RPC Call
sXML = fnXmlHttp(sSiteUrl + sCmdParameters,"");
// Create the XML Object Instance
var objXML = new ActiveXObject("MSXML2.DOMDocument");
// Load the XML
bLoad = objXML.loadXML(sXML);
// Check whether the XML is loaded into the document
if(bLoad)
{
// Declare all local variables
var iNotStarted = 0;
var iInProgress = 0;
var iCompleted = 0;
var iDeferred = 0;
var iWaitingonsomeoneelse = 0;
var sObjectData;
var objData = objXML.documentElement.childNodes(1);
// Loop through all the variables
for (i=0;i<objData.childNodes.length;i++)
{
var Status = objData.childNodes(i).attributes.getNamedItem("ows_Status").value;
switch(Status)
{
case "Not Started":
iNotStarted = iNotStarted + 1; break;
case "In Progress":
iInProgress = iInProgress + 1; break;
case "Completed":
iCompleted = iCompleted + 1; break;
case "Deferred":
iDeferred = iDeferred + 1; break;
case "Waiting on someone else":
iWaitingonsomeoneelse = iWaitingonsomeoneelse + 1; break;
default:
break;
}
}
// Create the Object for the Fusion Chart
// Opening Object Tag
sObjectData = "<object classid=\"clsid:D27CDB6E-AE6D-11cf-96B8-444553540000\" ";
sObjectData += "codebase=\"http://download.macromedia.com/pub/shockwave/cabs/flash/swflash.cab#version=6,0,0,0\" ";
sObjectData += "width=\"400\" ";
sObjectData += "height=\"300\" ";
sObjectData += "id=\"Pie3D\"> ";
// Setting Parameters
sObjectData += "<param name=\"movie\" value=\"http://localhost/sites/MOSSDemos/FusionCharts/FusionCharts/FCF_Pie3D.swf?chartWidth=400&chartHeight=300\"> ";
sObjectData += "<param name=\"FlashVars\" value=\"&dataXML=<graph caption='Tasks By Status Percentage' ";
sObjectData += "xAxisName='Site' yAxisName='Qty by Site' showNames='1' decimalPrecision='1' showPercentageInLabel='1' formatNumberScale='0' ";
sObjectData += "pieYScale='70' pieBorderAlpha='40' pieFillAlpha='80' pieSliceDepth='15'> ";
sObjectData += "<set name='Not Started' value='" + iNotStarted + "' color='#660033' link='' /> ";
sObjectData += "<set name='Completed' value='" + iInProgress + "' color='#3399ff' link='' /> ";
sObjectData += "<set name='In Progress' value='" + iCompleted + "' color='#99cc99' link='' /> ";
sObjectData += "<set name='Deferred' value='" + iDeferred + "' color='#00ff99' link='' /> ";
sObjectData += "<set name='Waiting for someone else' value='" + iWaitingonsomeoneelse + "' color='#000033' link='' /> ";
sObjectData += "</graph>\"> ";
sObjectData += "<param name=\"quality\" value=\"high\"> ";
sObjectData += "</object> ";
document.write(sObjectData);
}
</script>
Following are the lines to be changed in the script:
A. Location of the FCF_Pie3D.swf file within the "object" tag.
B. Site Url in the variable "sSiteUrl".
C. Task List Id in the variable "sCmdParameters".
With this, A Pie chart representations the Task Data within the SharePoint List as shown below:


